Peter Drucker, the father of modern management, famously stated, “what gets measured gets improved.”
If you agree with his quote and the importance of measuring things in your business, the challenging part can be figuring out what to measure, how you should measure it, and when.
Enter KPIs.
What are KPIs?
KPIs also known as “Key Performance Indicators” are measurable values used to gauge how effectively a company is achieving key business objectives.
KPIs can be used to monitor large scale business objectives and the overall health of the company. They can also be used to monitor the success of business objectives within various departments within a company, and can even be used on an individual level to monitor employees’ key objectives.
How to set KPIs
The first step to setting KPIs is to decide the objective you are trying to monitor.
For example, if you are monitoring the overall success of your business, you will choose different KPIs compared to if you were setting up KPIs to monitor only sales growth or only the efficiency of your supply chain.
Once you’ve decided the objective you’re setting up KPIs for, the next step is to decide on key and measurable factors that contribute to the achievement of that objective. For example, if you are setting up KPIs for the objective of “growing sales by 10%”, some key KPIs you can monitor could include revenue, profit, marketing costs, number of leads, number of customers, cost per lead, landing page conversions, etc.
How are you accepting payments?
Learn all the ways to accept online payments
Click here to access the FREE [Cheat-Sheet]
There are literally thousands of KPIs that can be used in a business. It’s important to pick the indicators that align closely to you achieving your objectives and it’s important to not get carried away and monitor too many KPIs.
Try It Out
Rather than just talking about KPIs, let’s talk through a specific example that just may work for your company. Even if this isn’t the goal you want to monitor it may be good to crunch these numbers for your business in order to practice.
Context: In this example, we’ll be considering a consulting business looking to grow revenue (although this example could work for many types of businesses).
Step 1: Set a Specific Objective
- To grow revenue by 10% each month.
Step 2: Choose KPIs that make sense for the objective of growing revenue by 10% each month
KPIs chosen and explanation of choice:
- Revenue
- We must monitor revenue to monitor if it is growing. Each month we will multiply last month’s revenue by 110% to set our goal of 10% growth in revenue each month.
- Number of Customers
- To increase revenue, we can either increase the number of customers we have, or increase the amount of revenue generated from each customer each month. By monitoring the number of customers as a baseline in addition to the average revenue per customer and number of new customers, we will get insight into which strategy is working better (increasing customer or increasing revenue per customer).
- Average Revenue Per Customer
- See explanation in “number of customers”
- Number of New Customers
- See explanation in “number of customers”
Step 3: Monitoring and reporting
- Raw data over 2 months may look something like below
- Revenue
- Month 1: $40,000
- Month 2: $45,000
- Number of Customers
- Month 1: 4
- Month 2: 5
- Average Revenue Per Customer
- Month 1: $10,000
- Month 2: $9,000
- Number of New Customers
- Month 1: 0
- Month 2: 1
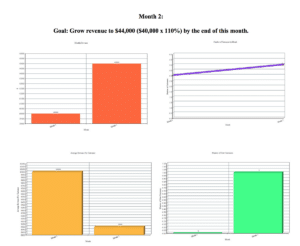
- In order to make the KPIs easier to visualize, we would put them into context in a dashboard. In this example, the goal for the month was exceeded. An interesting fact is that while most of our numbers went up, the average revenue per customer went down. Putting KPIs in a visual dashboard can help you quickly see interesting correlations like this. See below for an example:
- Revenue
Holding your Business Accountable to KPI’s
To be useful, once you’ve set your KPIs you should double check to make sure they are well defined and quantifiable and then you should communicate them throughout your organization and department.
Once they’ve been communicated, they should be monitored and reported on a regular basis. KPIs are typically put together in a visual report called a dashboard. Like the dashboard on a car, a business dashboard allows you to see your KPIs quickly, and easily understand whether you are getting closer or farther away from your goal (similar to how car dashboard tells you when you are about to run out of gas, or when your car may overheat).
In order to better communicate your KPIs with your team, it’s helpful to create a large visual dashboard that show the changes in KPIs over time and post it somewhere that people will see it often. This will give your team a constant reminder of the goal, the important factors that contribute to that goal, and whether they are moving in the right direction over time.